16S Data Analysis Part I
Elizabeth Costello, Ph.D. - Stanford University
Workshop materials can be found here:
https://elsherbini.github.io/durban-data-science-for-biology/
Practicalities
WiFi:
Network: KTB Free Wifi (no password needed)
Network AHRI Password: @hR1W1F1!17
Network CAPRISA-Corp Password: corp@caprisa17
Bathrooms are out the lobby to your left
Hello 👋👋
My name is Elizabeth Costello (Liz)
I’m a Research Scientist in David Relman’s lab at Stanford University’s School of Medicine.
I enjoy microbial ecology, bioinformatics AND spending time outdoors.

Liz kayaking
Workflow check-in
Let’s review what we’ve done and what’s next
Done: Starting with the raw sequence data, we filtered, trimmed, inferred ASVs, removed chimeras, and assigned taxonomy.
Next up: Take the results of these steps (count table; taxonomy table) and do some initial and exploratory data analysis.
🎯 Goals for this module
Understand what exploratory data analysis is
Apply exploratory data analysis to 16S data
- Get to know the data
- Create a
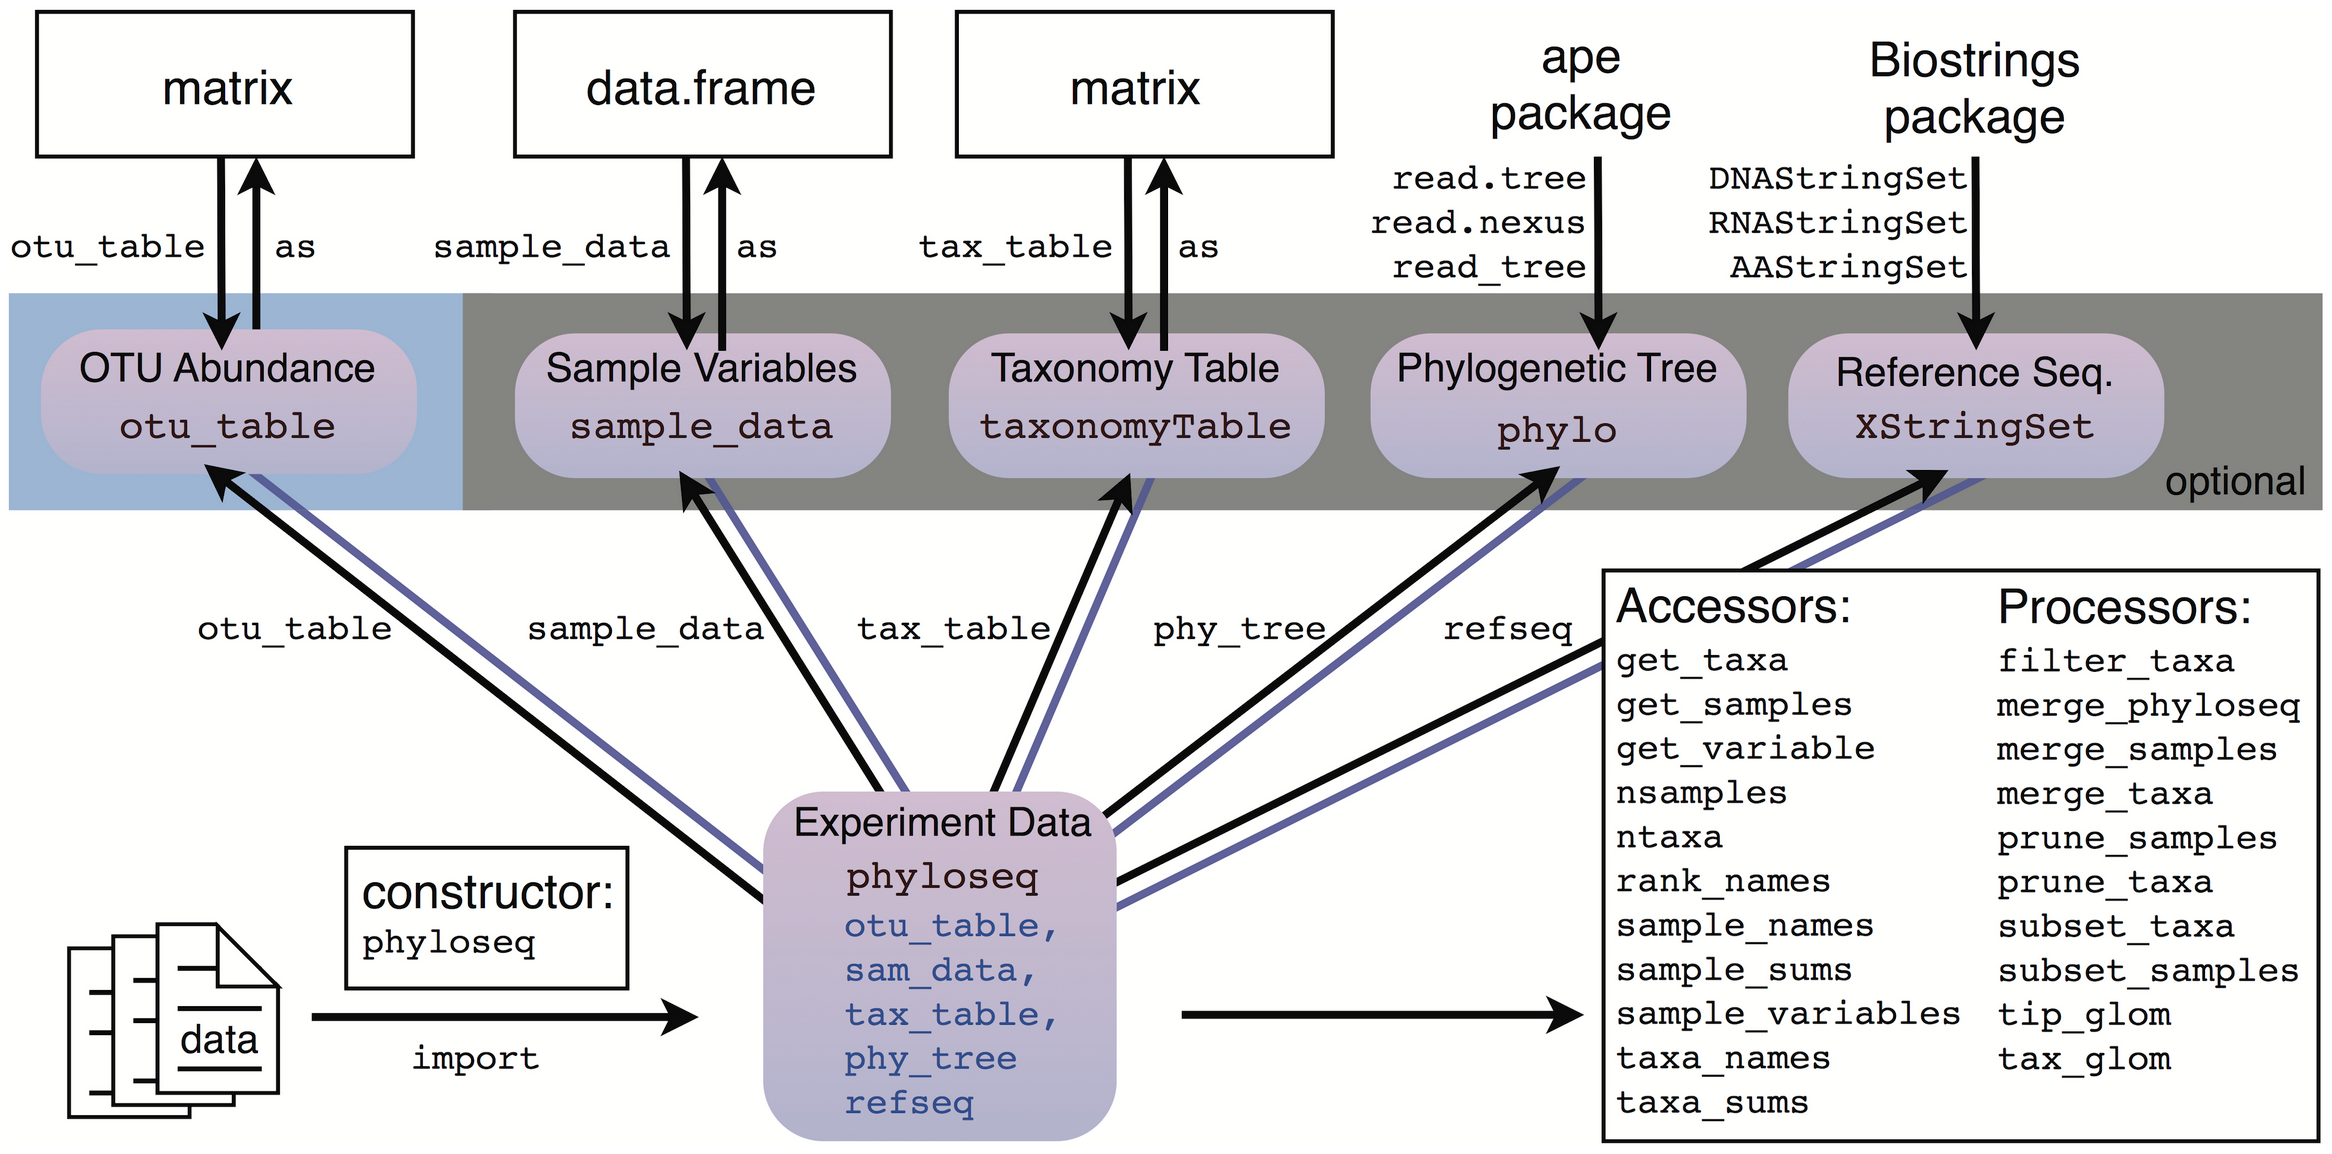
phyloseqobject - Explore (stacked) bar plots
- Explore alpha (within-sample) diversity
- Explore beta (between-sample) diversity using ordination
Become familiar with the
phyloseqpackage
Exploratory data analysis
A popular quote:
“Exploratory data analysis is an attitude, a flexibility, and a reliance on display, NOT a bundle of techniques” -John Tukey
🫣 What do the data look like? 🔬
Key considerations for molecular survey data
- Uneven/incomplete sampling depth
- Wideness/sparseness
- Compositionality
- Collinearities
- Confounders
- “Garbage in, garbage out”
The phyloseq package

McMurdie & Holmes (2013)
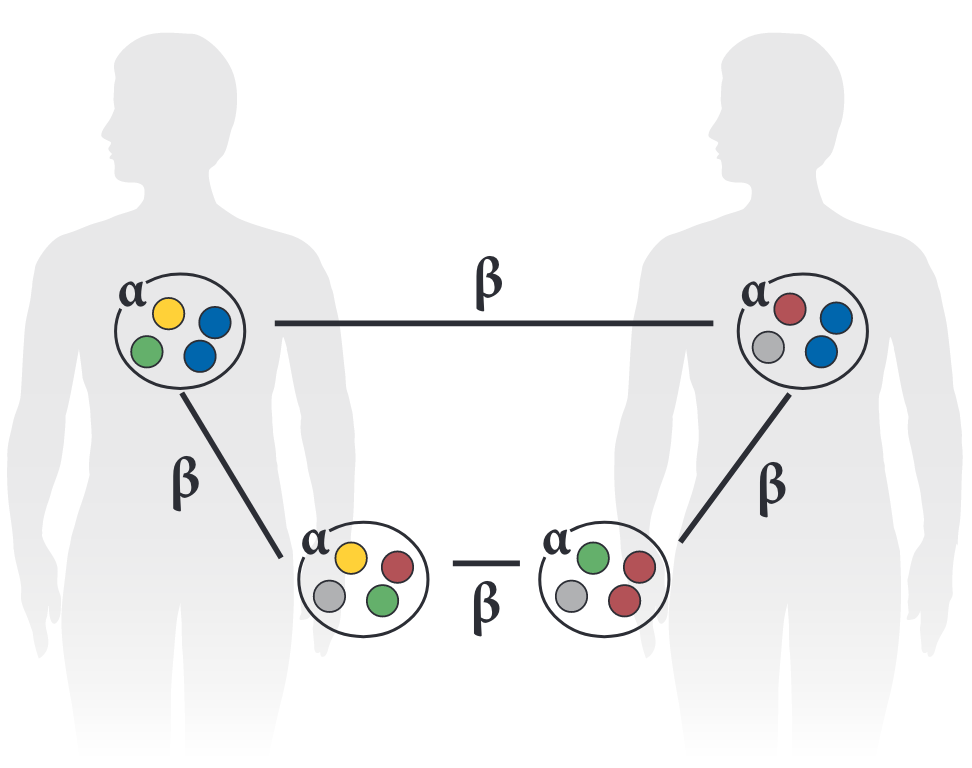
Alpha diversity (𝜶)

- Within-sample diversity
- Richness: The number of taxa or lineages within a given sample
- Evenness: The relative abundance of taxa or lineages within a given sample
- A metric that considers both richness & evenness (e.g., the Shannon diversity index)
Beta diversity (β)

- Between-sample diversity
- Taxonomic or phylogenetic difference in community composition between samples
- Various measures of pairwise resemblance
- Dimensionality reduction (e.g., ordination)
- Identify primary sources of variation in data
Let’s analyze some data!
Go to RStudio, navigate to directory 16S_part1, and open Quarto document 16S_part1_code.qmd