| Characteristic | Overall N = 511 |
unchanged_diet N = 251 |
yogurt N = 261 |
p-value2 |
|---|---|---|---|---|
| Age (years) | 31.0 (28.0, 33.0) | 30.0 (28.0, 33.0) | 31.0 (29.0, 33.0) | 0.6 |
| Contraception | 0.017 | |||
| Depoprovera | 25 (49%) | 8 (32%) | 17 (65%) | |
| no hormonal birth control | 26 (51%) | 17 (68%) | 9 (35%) | |
| Education | 0.8 | |||
| grade 10-12, matriculated | 10 (20%) | 6 (24%) | 4 (15%) | |
| grade 10-12, not matriculated | 21 (41%) | 9 (36%) | 12 (46%) | |
| less than grade 9 | 9 (18%) | 4 (16%) | 5 (19%) | |
| post-secondary | 11 (22%) | 6 (24%) | 5 (19%) | |
| Days since last sex | 5 (3, 11) | 6 (3, 10) | 5 (3, 11) | 0.8 |
| 1 Median (Q1, Q3); n (%) | ||||
| 2 Wilcoxon rank sum test; Pearson’s Chi-squared test; Fisher’s exact test | ||||
Yogurt & the vaginal microbiome
An example group-project presentation · Group A
Part 1 · The dataset
The study
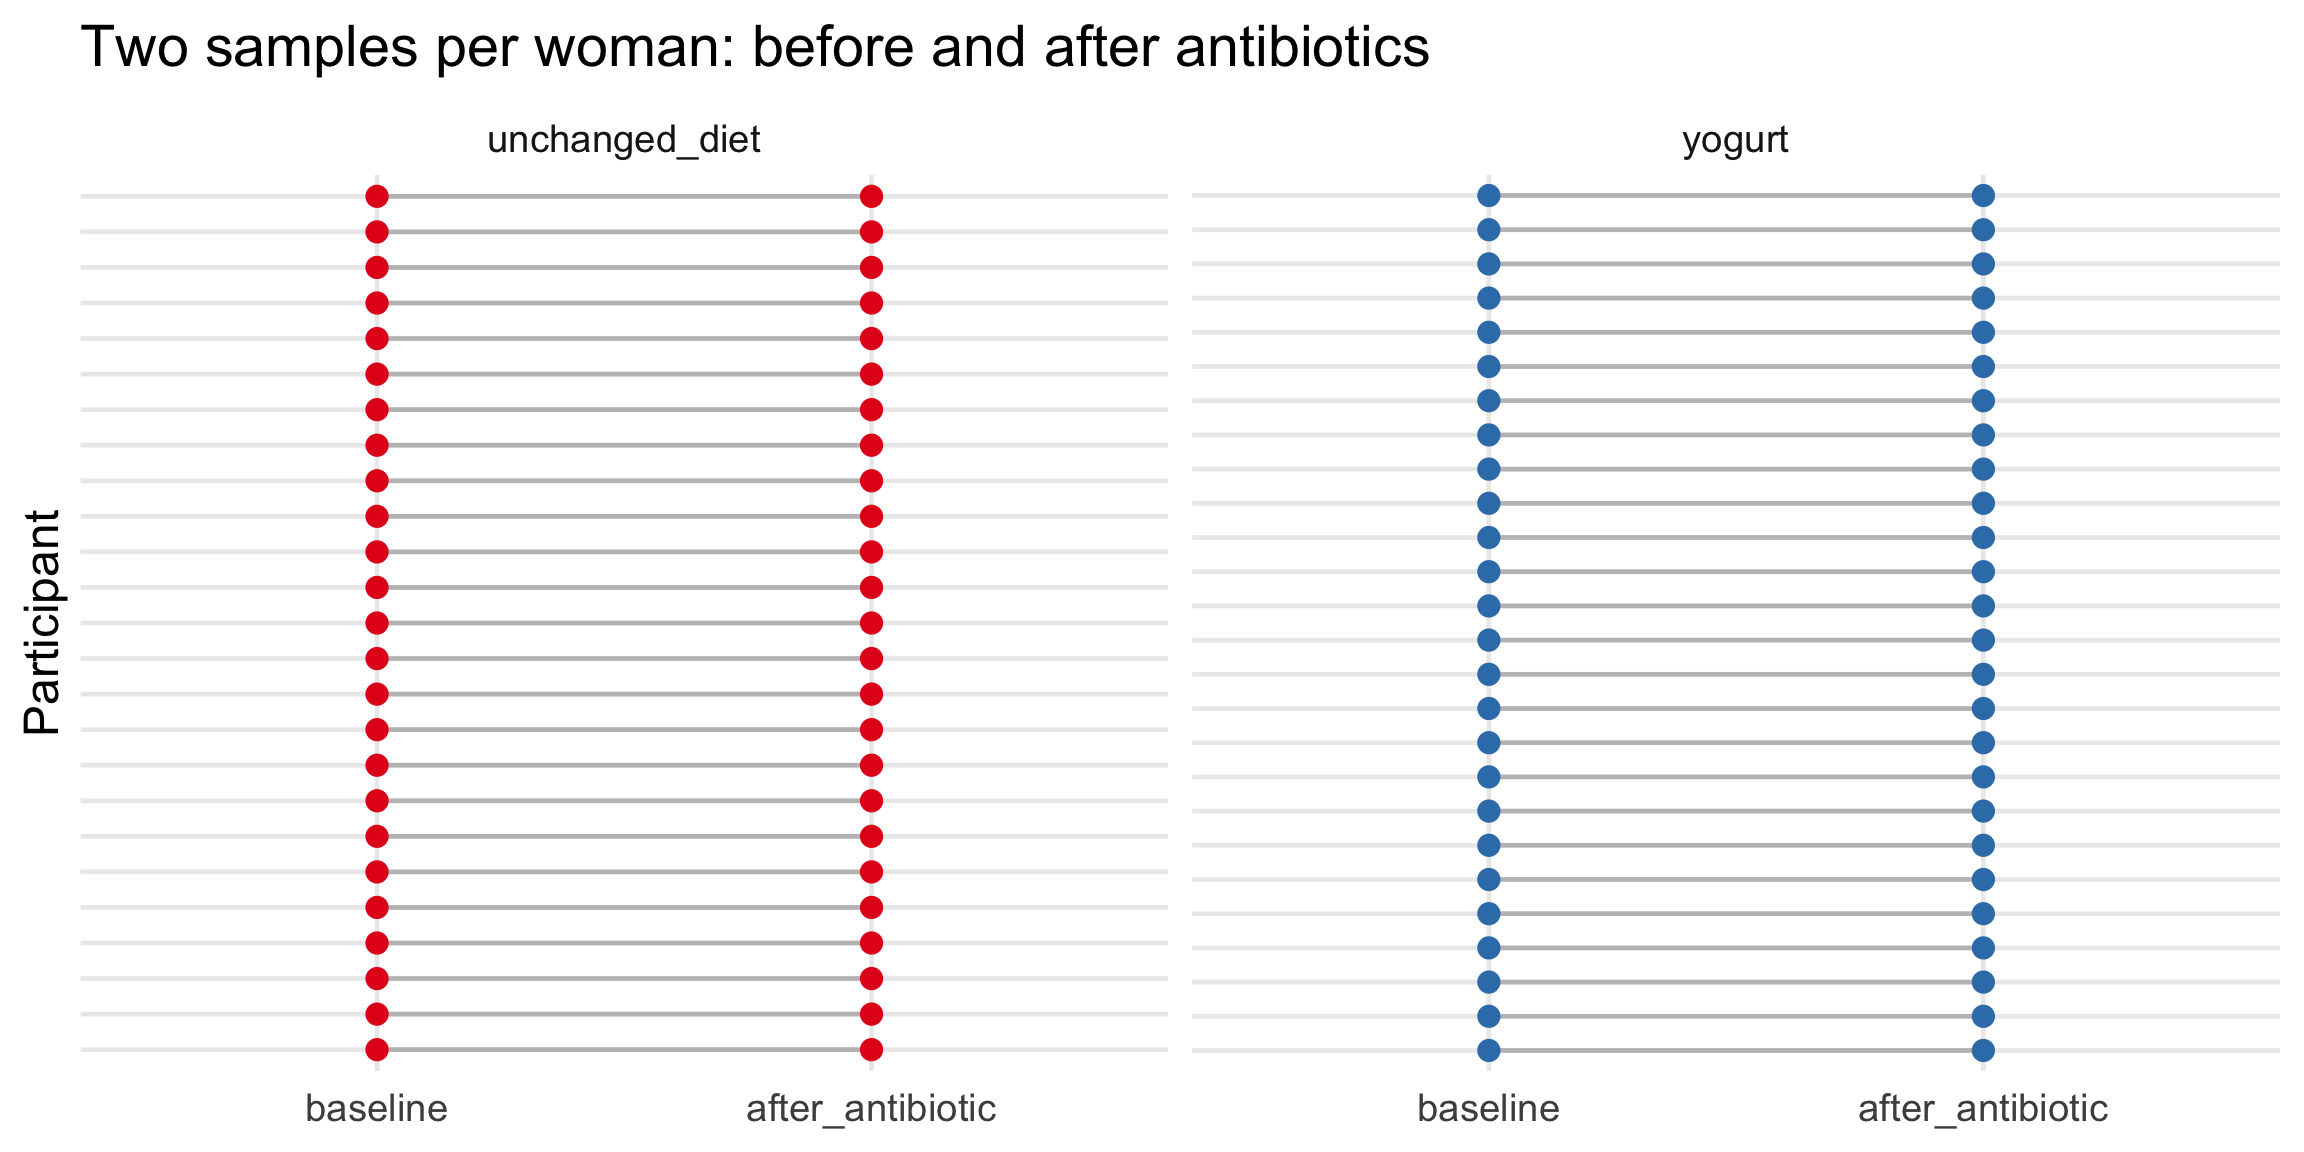
A randomized controlled trial in 51 women. Everyone received a course of antibiotics; half were randomized to eat yogurt daily, half kept their usual diet.
Each woman was sampled twice — once at baseline, once after the antibiotic course — and three kinds of measurement were taken from each sample:
- qPCR — absolute load of total bacteria, L. crispatus, and L. iners
- Luminex — concentrations of 10 cytokines (inflammation markers)
- participant metadata — age, contraception, education
The question: does yogurt shape how the vaginal microbiome recovers from antibiotics?
Who is in the study?
A note on balance
The arms are well matched on age and education. Contraception is the one variable to keep in mind: Depo-Provera is roughly twice as common in the yogurt arm. Hormonal contraception can influence the vaginal environment, so it is a plausible confounder we would want to revisit.
How the study is laid out
The antibiotic course reshapes the microbiome
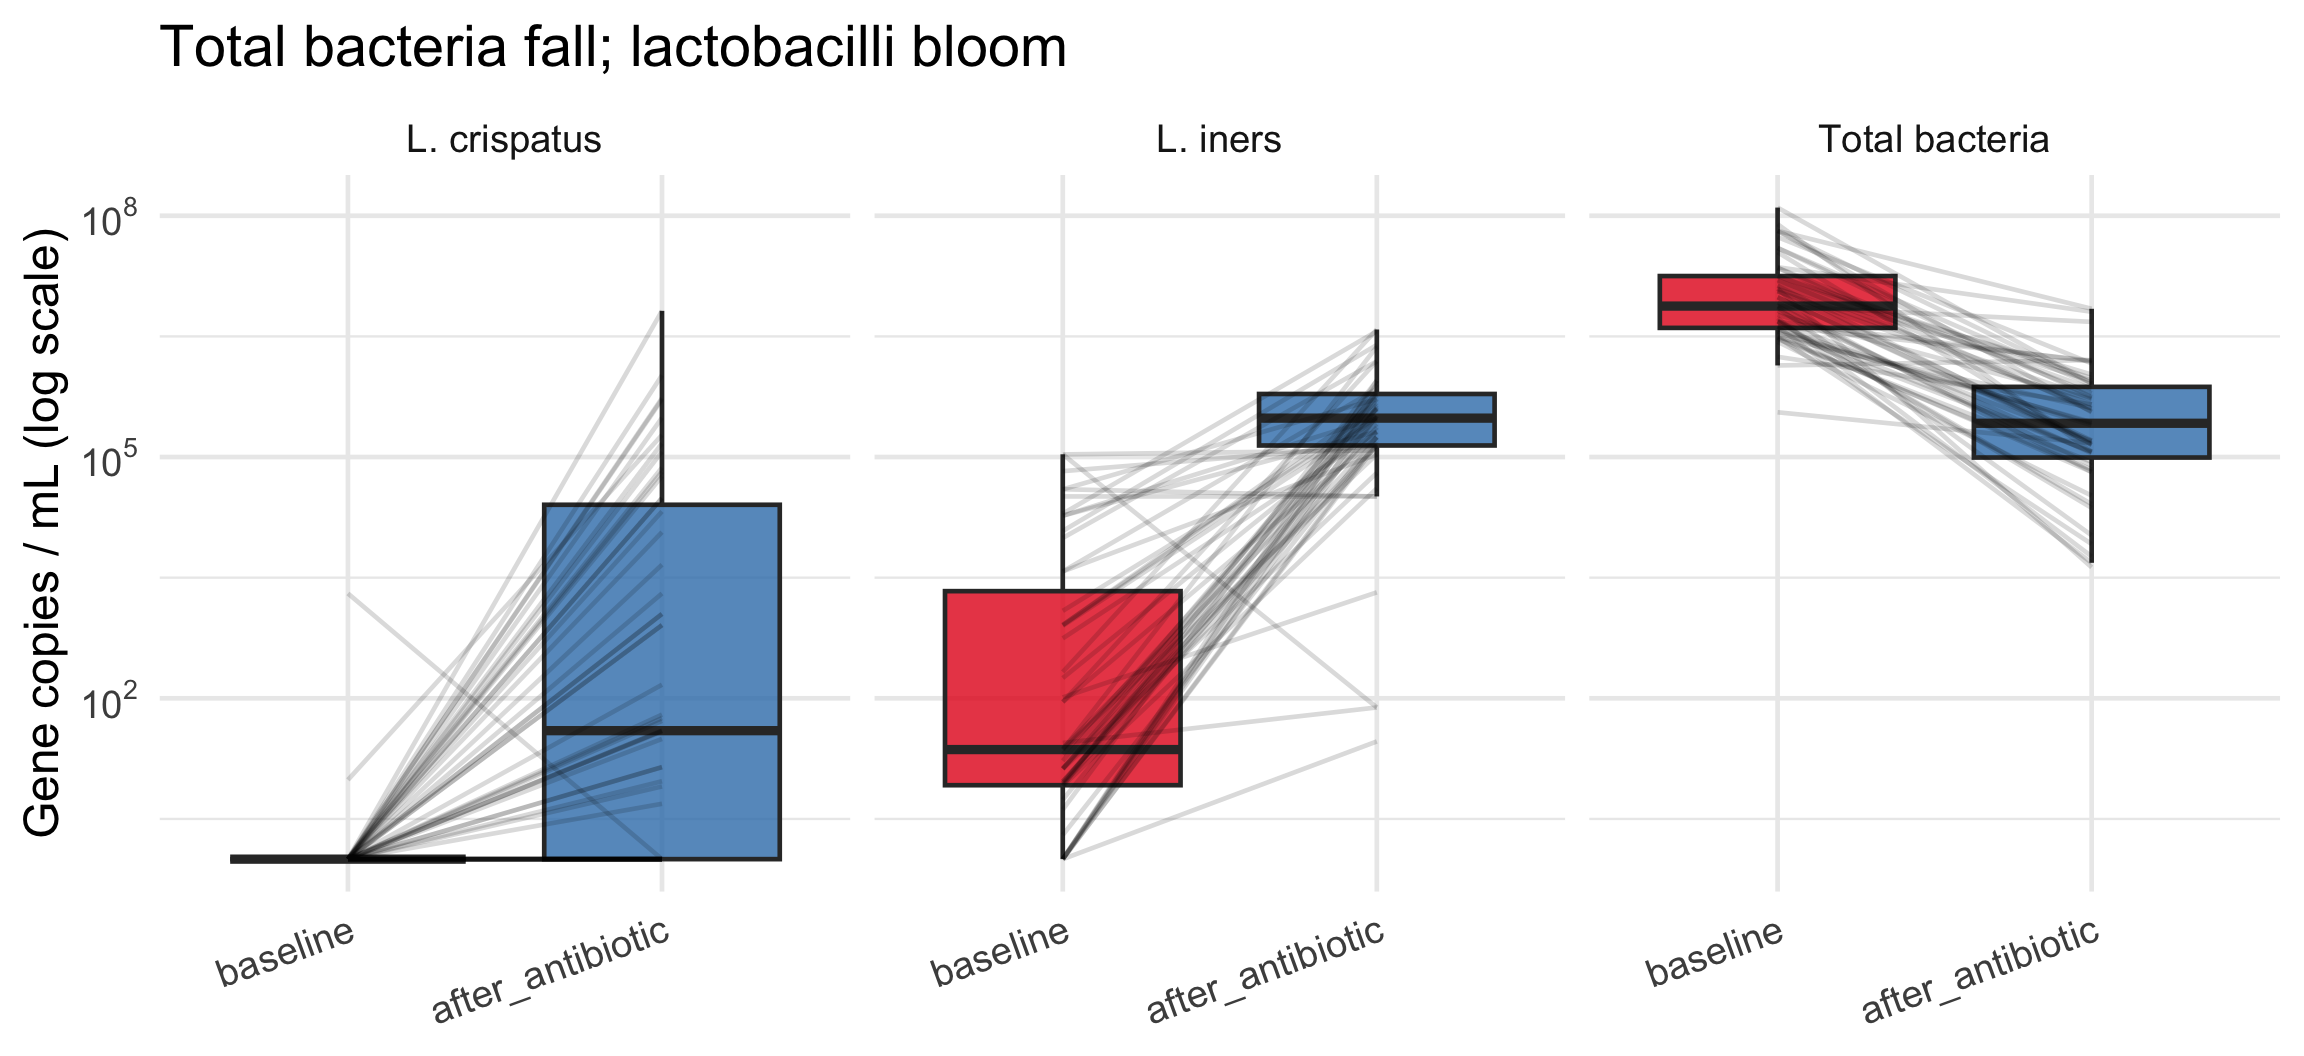
qPCR spans many orders of magnitude, so we always read it on a log scale.
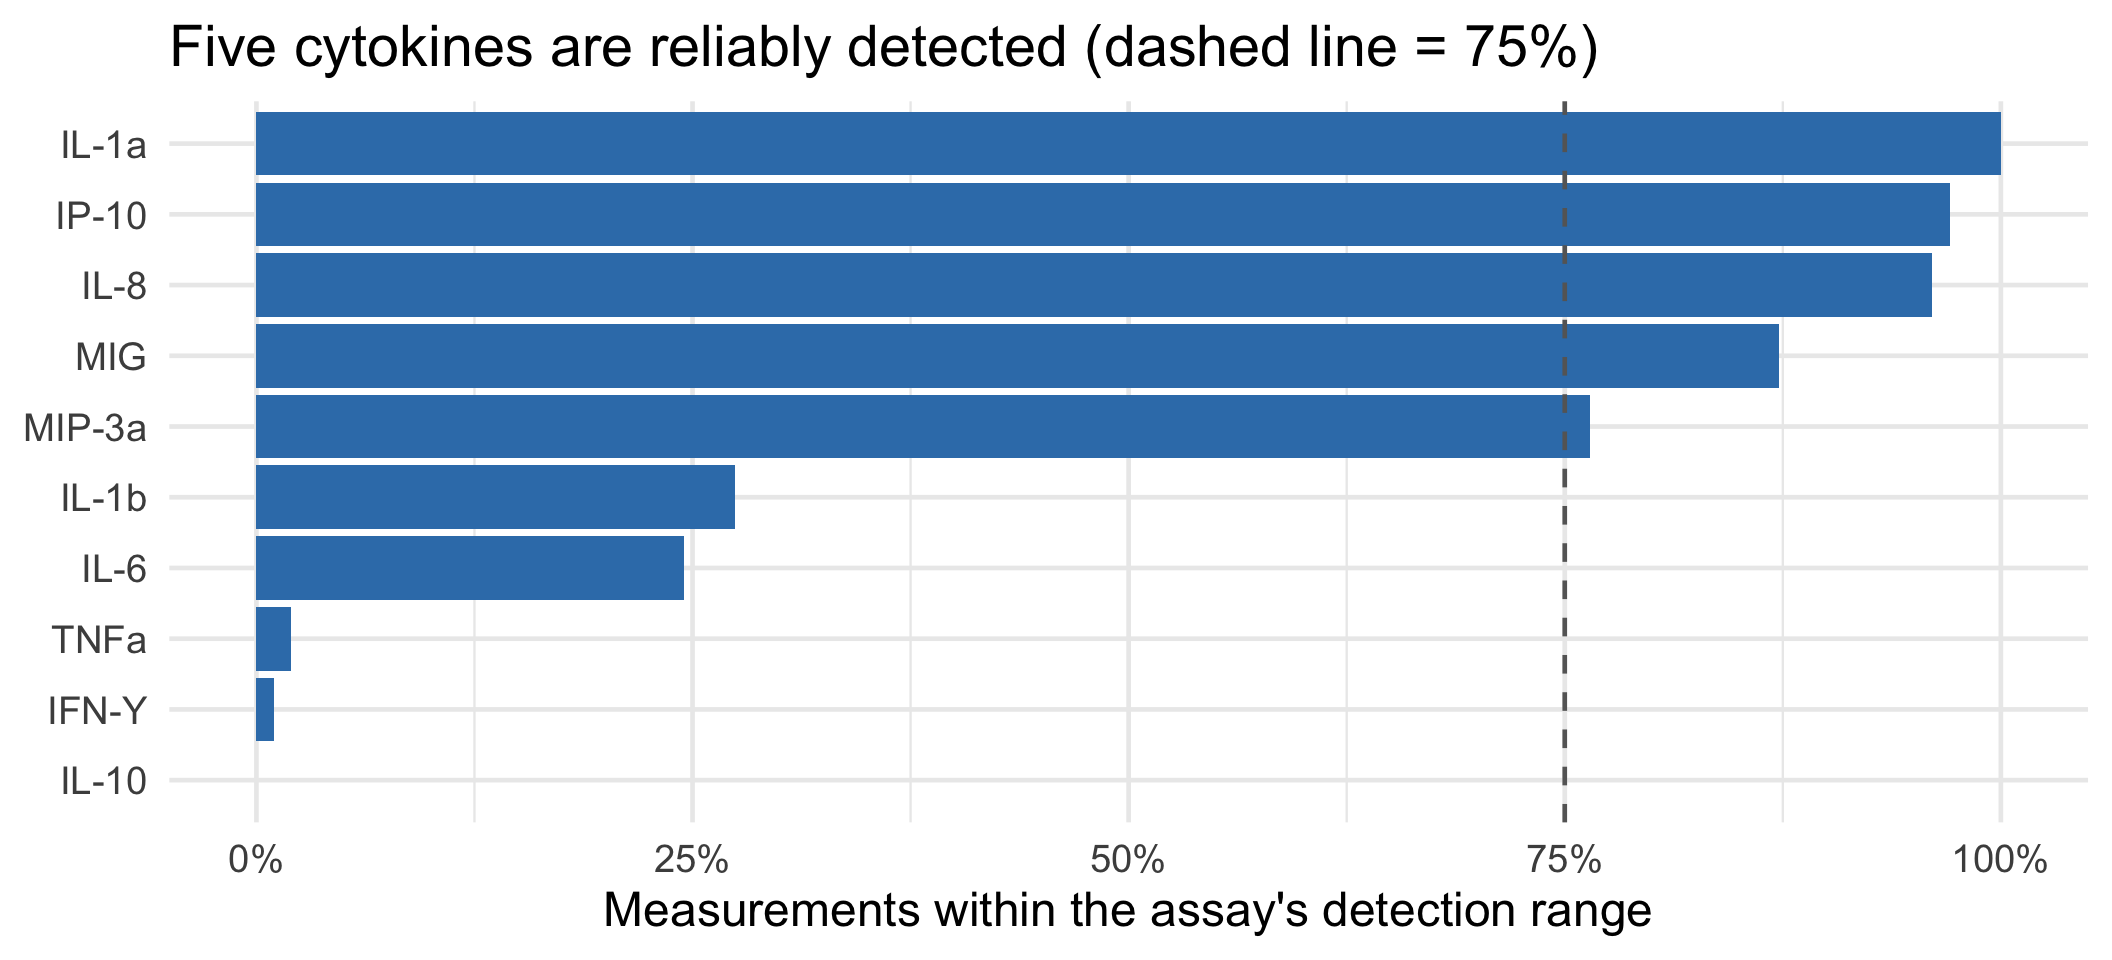
Which cytokines can we actually use?
Part 2 · Three short analyses
Three questions
- After antibiotics, do lactobacilli rebound, and does yogurt change the rebound?
- Does the antibiotic course change IL-1a, and does the effect depend on the diet arm?
- Across all cytokines, which ones shift from before to after?
Story 1 · Lactobacillus rebound
The question
After a course of antibiotics, total bacterial load drops sharply. The clinically interesting question is what grows back.
L. iners and L. crispatus are the “good” lactobacilli associated with a healthy vaginal environment. Do they rebound after antibiotics, and does eating yogurt change how much they rebound?
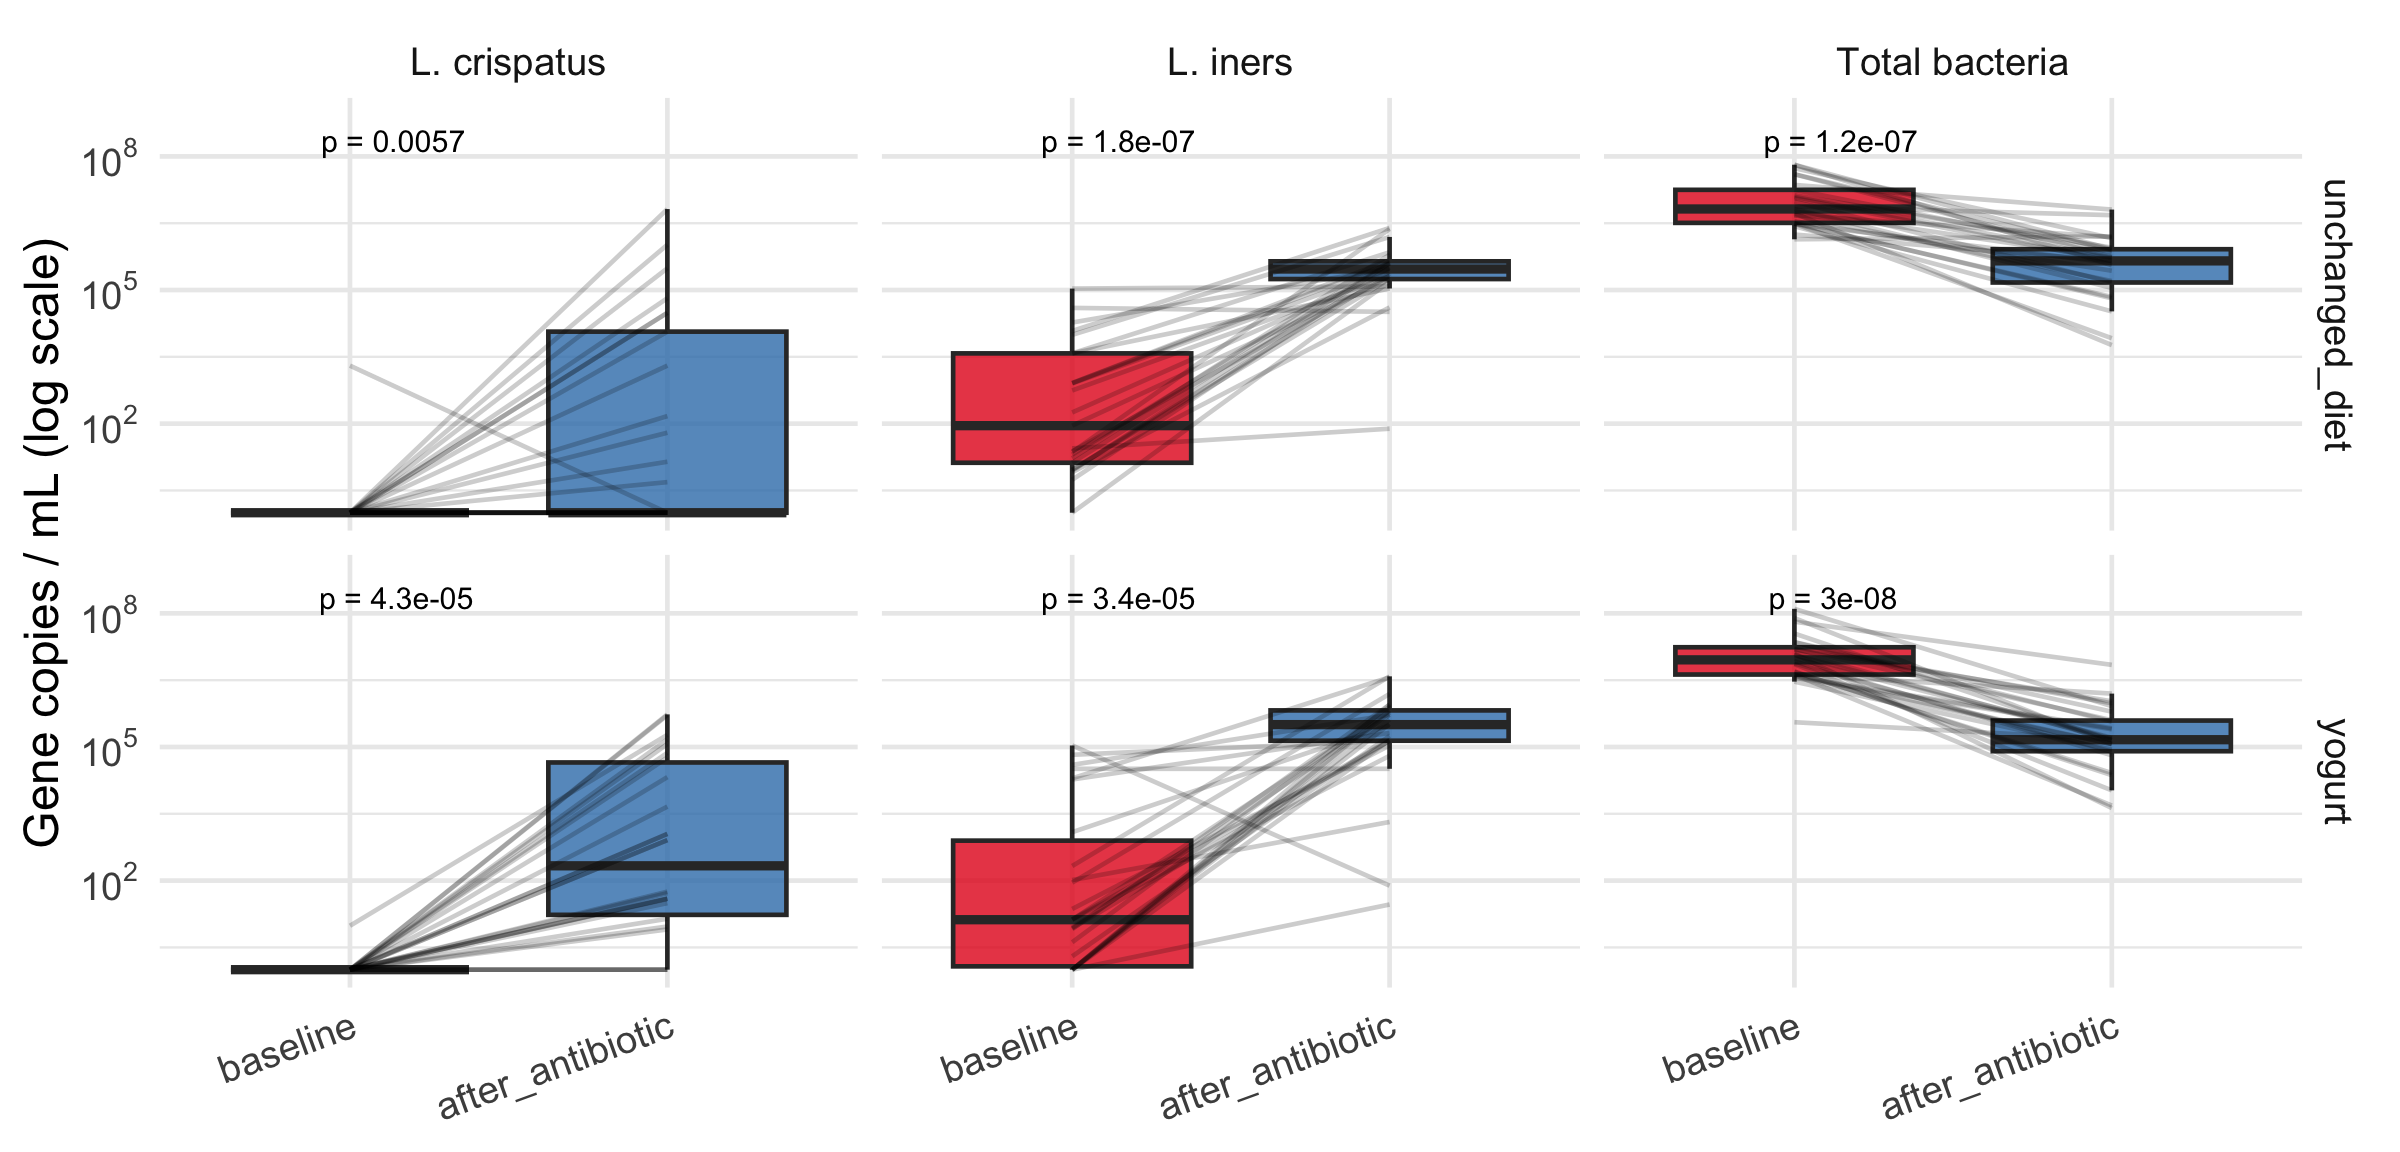
We compare each woman to herself (baseline vs after), separately within each arm, with a paired Wilcoxon test.
The code
qpcr_long |>
  ggplot(aes(time_point, copies + 1)) +
  geom_boxplot(aes(fill = time_point), outlier.shape = NA, alpha = 0.8) +
  geom_line(aes(group = pid), alpha = 0.2) +
  facet_grid(arm ~ target) +
  scale_y_log10(expand = expansion(mult = c(0.05, 0.15))) +
  scale_fill_brewer(palette = "Set1") +
  stat_compare_means(method = "wilcox.test", paired = TRUE,
                     label = "p.format", size = 4) +
  labs(x = NULL, y = "Gene copies / mL (log scale)")
A paired test pairs each woman’s after sample with her own baseline sample, so we measure within-person change, not differences between people.
The figure
What it means
- Total bacteria fall after antibiotics, as expected.
- L. iners blooms — its median jumps roughly four orders of magnitude in both arms (p < 0.001). This is the dominant recovery signal.
- L. crispatus is undetectable in most women at both timepoints, so its test is underpowered.
- The rebound looks the same with or without yogurt: the after boxes sit at the same height in both rows.
The headline: antibiotics clear the field and L. iners repopulates it — yogurt does not visibly steer that process.
Story 2 · Modeling IL-1a
The question
L. iners came back. Did inflammation come down with it?
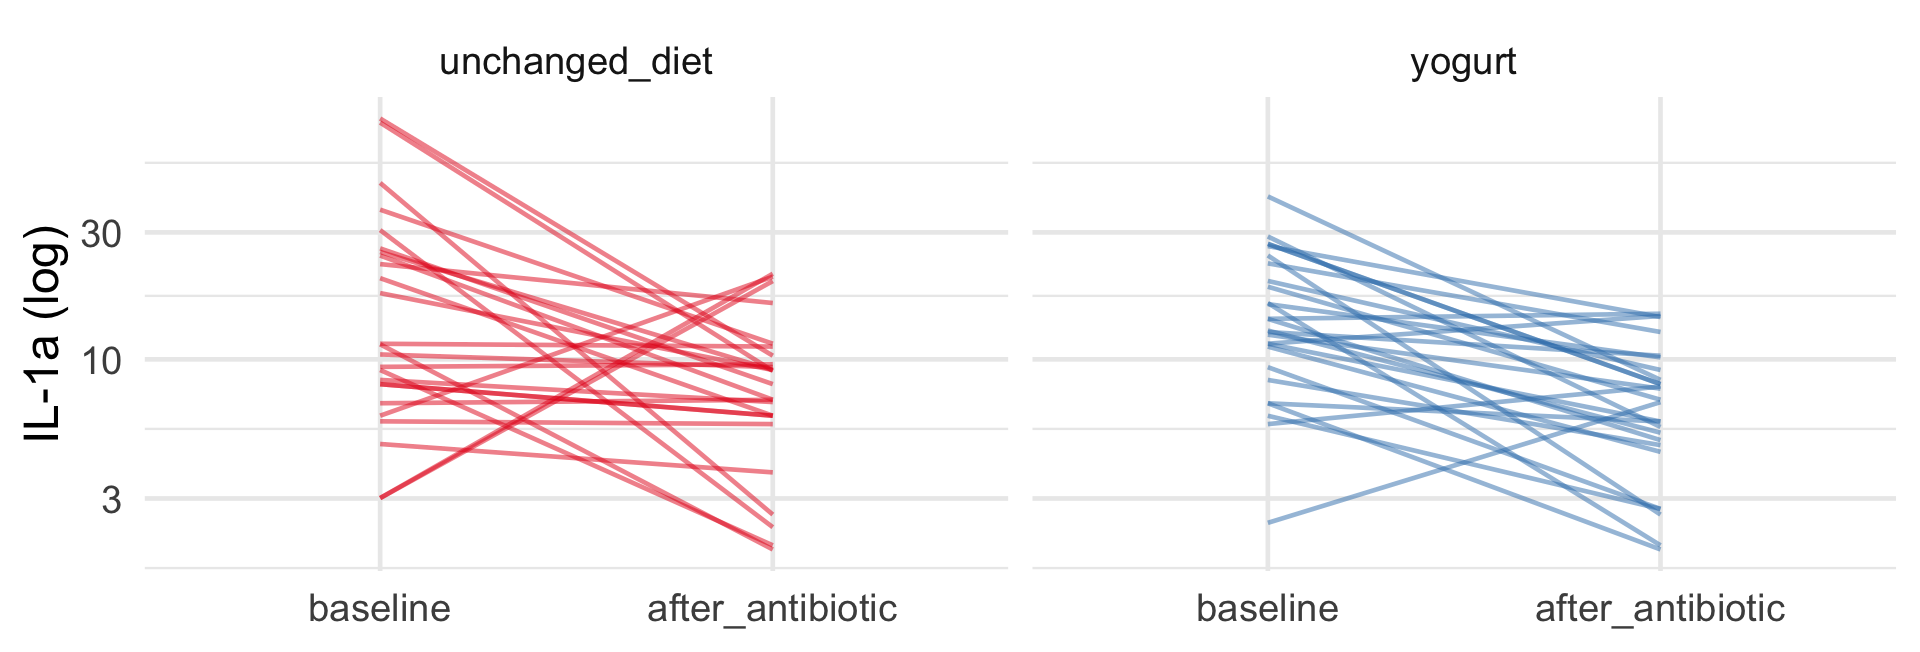
IL-1a is the best-detected cytokine here, so we model it directly. We want two things at once: the change after antibiotics, and whether that change differs by arm. That calls for an interaction model, with a per-participant random effect because each woman appears twice.
The code
arm:time_point lets the after-antibiotic change be different in each arm. (1 | pid) says the two samples from one woman are correlated. We model log(conc) because cytokine measurement error is multiplicative.
The table
| Term | Beta | 95% CI | p-value |
|---|---|---|---|
| (Intercept) | 2.6 | 2.3, 2.9 | <0.001 |
| arm | |||
| unchanged_diet | — | — | |
| yogurt | -0.02 | -0.41, 0.37 | >0.9 |
| arm * time_point | |||
| unchanged_diet * after_antibiotic | -0.63 | -1.0, -0.23 | 0.003 |
| yogurt * after_antibiotic | -0.77 | -1.2, -0.37 | <0.001 |
| Abbreviation: CI = Confidence Interval | |||
What it means
Reading the coefficients on the log scale:
- At baseline the arms are level (
arm yogurt≈ 0, p = 0.9) — randomization worked. - IL-1a falls after antibiotics in both arms: about −0.63 in the unchanged-diet arm and −0.77 in the yogurt arm, both clearly significant.
- The two drops are close in size, so yogurt does not meaningfully change the inflammatory response.
Same conclusion as Story 1, reached a different way: the microbiome recovers and inflammation subsides, with or without yogurt.
Story 3 · The whole cytokine panel
The question
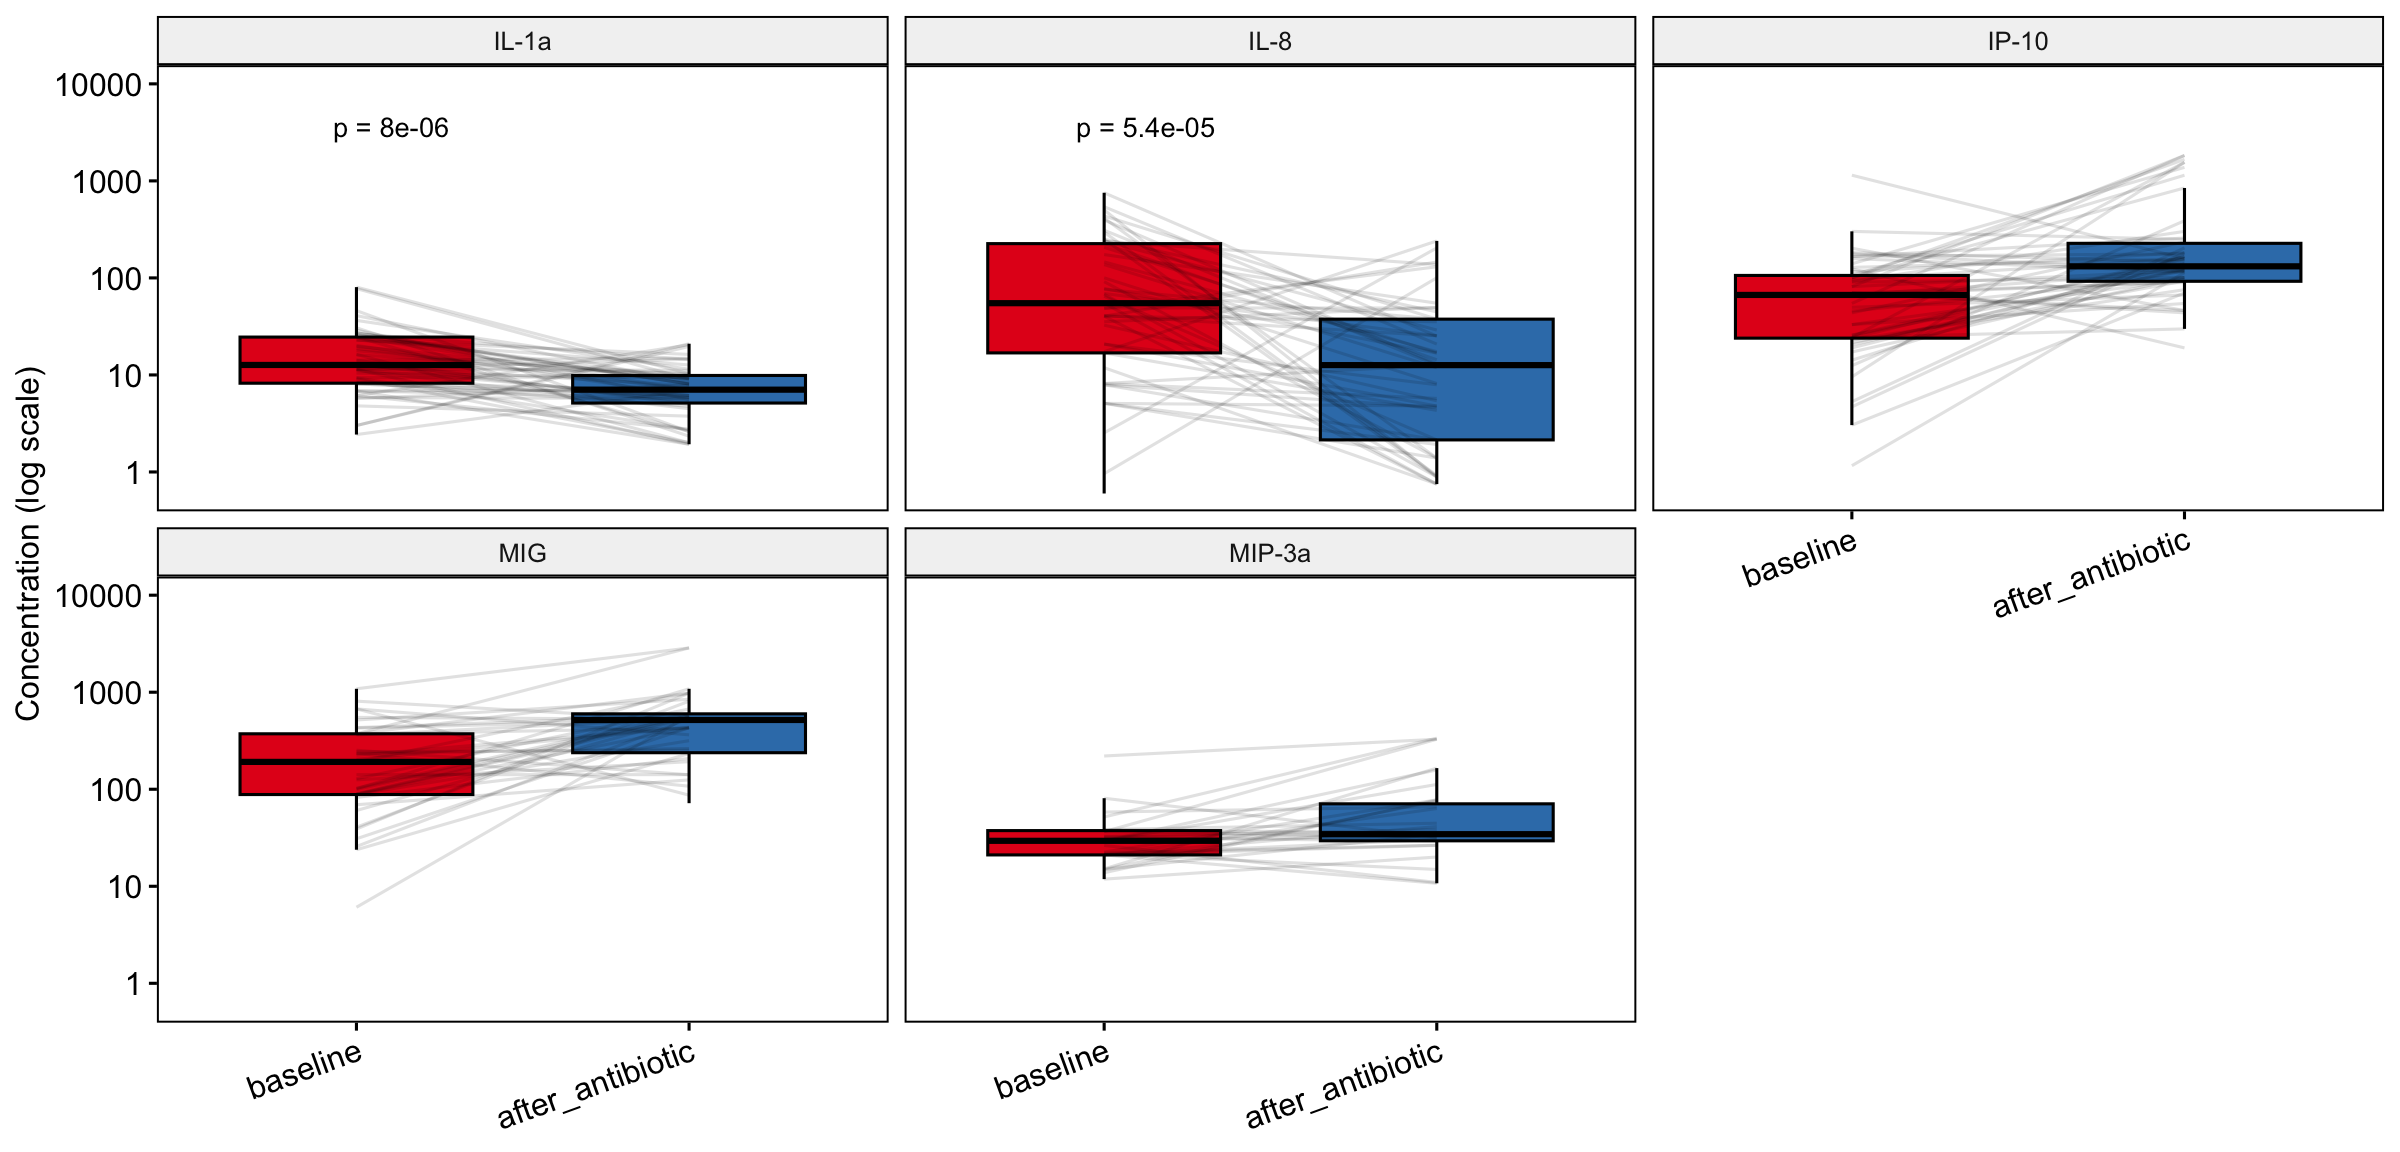
IL-1a fell. Was it special, or does the whole inflammatory panel come down after antibiotics?
We run the same paired test on every well-detected cytokine at once, then correct for testing several hypotheses.
The code
panel <- cyt |> filter(limits == "within limits")

# one paired Wilcoxon per cytokine, then Benjamini-Hochberg
panel |>
  pivot_wider(id_cols = c(pid, cytokine),
              names_from = time_point, values_from = conc,
              values_fn = mean) |>
  drop_na() |>
  group_by(cytokine) |>
  summarise(p = wilcox.test(baseline, after_antibiotic,
                            paired = TRUE)$p.value, n = n()) |>
  mutate(p_BH = p.adjust(p, "BH")) |>
  arrange(p_BH)
The figure
What it means
| Cytokine | n pairs | p | p (BH) |
|---|---|---|---|
| IL-1a | 51 | <0.001 | <0.001 |
| IP-10 | 48 | <0.001 | <0.001 |
| IL-8 | 47 | <0.001 | <0.001 |
| MIG | 38 | <0.001 | <0.001 |
| MIP-3a | 28 | 0.002 | 0.002 |
Five cytokines move together and all survive Benjamini-Hochberg correction. The inflammatory panel comes down as a group after antibiotics — IL-1a was representative, not exceptional.
Wrap-up
What we found
- Antibiotics drop total bacterial load; L. iners repopulates strongly.
- Inflammation subsides alongside that recovery, across the cytokine panel.
- Yogurt left no visible fingerprint on either process in this trial.
A caveat and a next step
- Depo-Provera was imbalanced between arms; a fair yogurt comparison should adjust for it.
- Everything here used only the workshop’s own toolkit —
tidyverse,gtsummary,ggpubr, andlme4— assembled with an LLM assistant. The judgement about which test, which scale, and what it means stayed with us.